03. Exercise: Visualize Distributions
Many variables tend to follow a Normal distribution (hence the name “Normal”), both in nature as well as artificial contexts. But there are other distributions as well, some that are variants of the Normal distribution, and some that are completely different! Each distribution is suitable for modeling certain kinds of variables.
In this exercise, you are given some samples of data. Plot the histogram of each sample, and then try to match it with the corresponding distribution.
Fill in the function
plot_histogram
with a line that plots a histogram of the data contained in the variable
sample
. Then write another line of code to show the plot.
see documentation
Hint : check out the documentation here
Start Quiz:
Match samples with distributions
QUIZ QUESTION: :
Listed below are some common distributions. Match the samples (A, B, C, D) with their corresponding distributions based on the histograms you plotted above.
You may refer to the figure below as a reference for what these distributions look like.
ANSWER CHOICES:
|
Sample |
Distribution |
|---|---|
|
Log-Normal |
|
|
Exponential |
|
|
Normal |
|
|
Uniform |
SOLUTION:
|
Sample |
Distribution |
|---|---|
|
Log-Normal |
|
|
Exponential |
|
|
Normal |
|
|
Uniform |
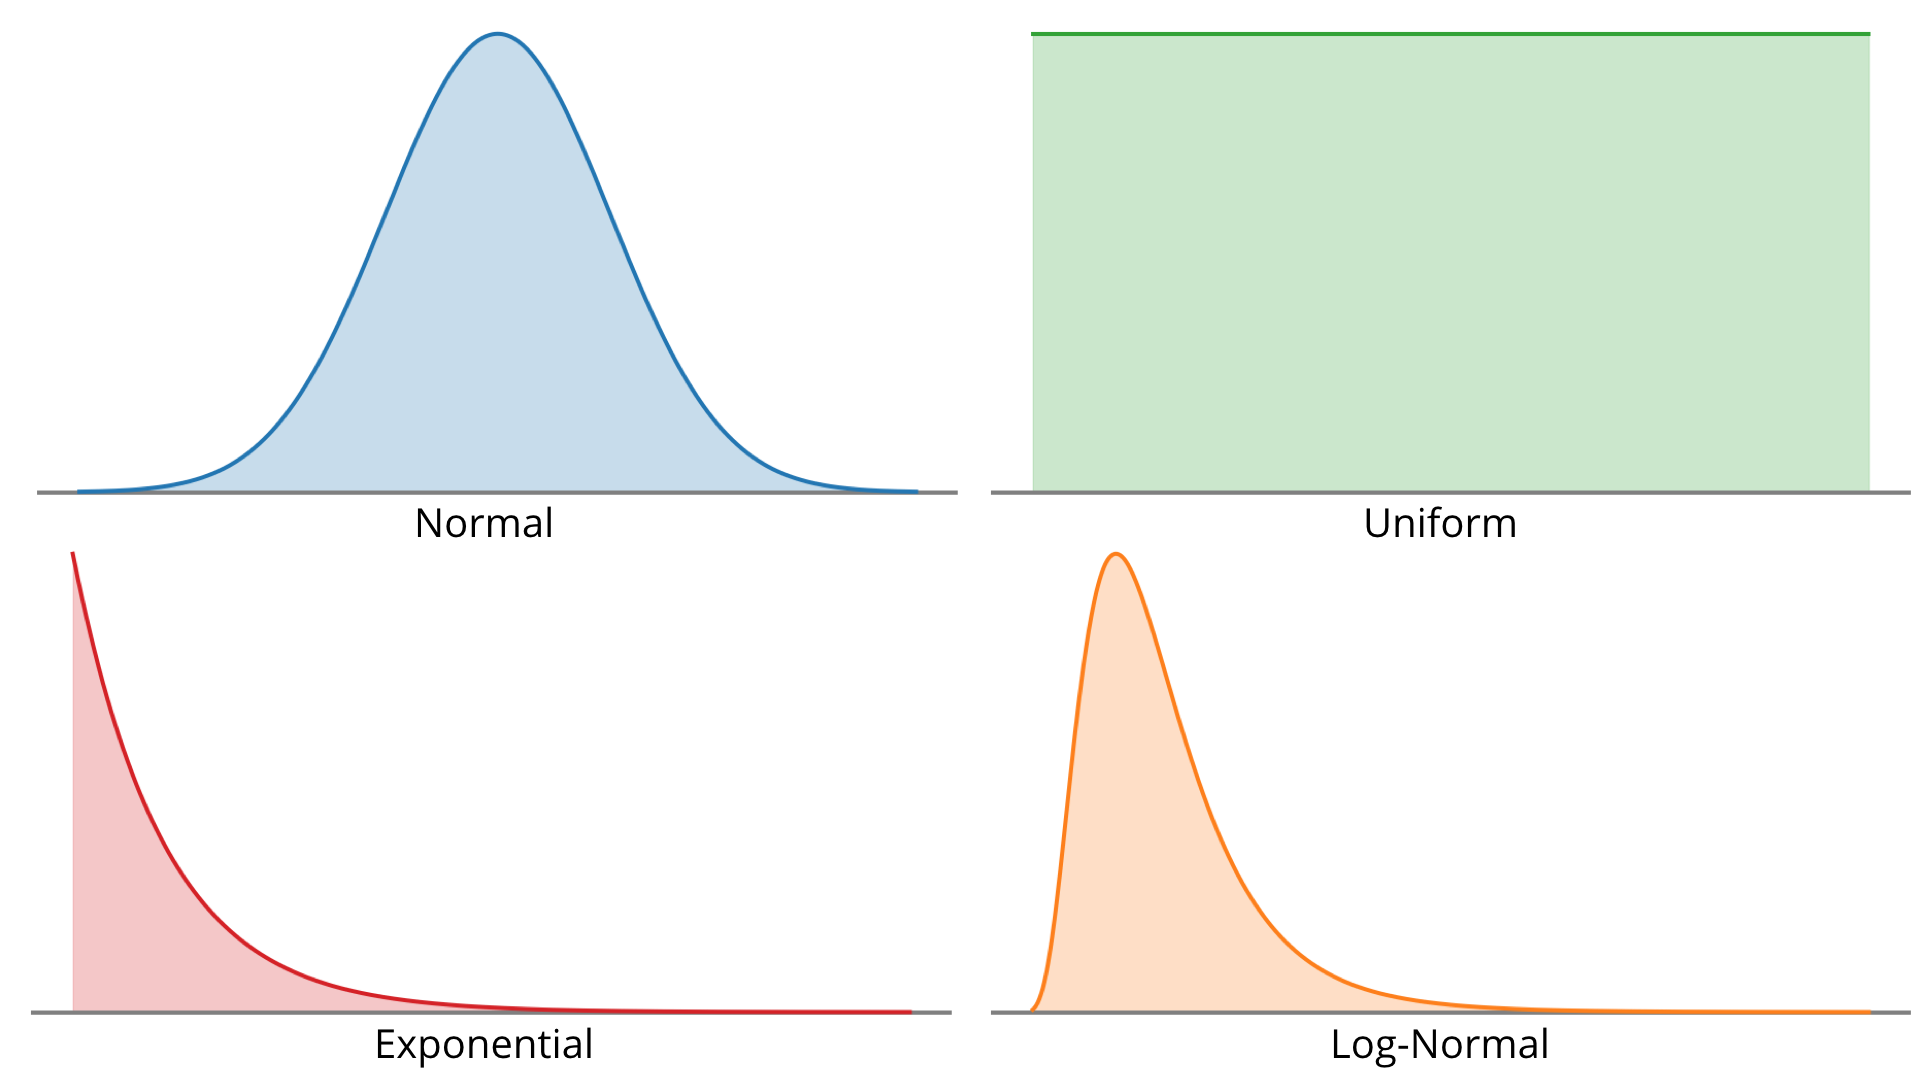
Probability Density Functions (PDFs) of common distributions